

Spark Grids
Spark Grids are grids that incorporate micro-charts that are segmented by the different columns and rows within the grid itself. They are extremely useful when trying to get a simple, abstracted view of large sets of data without detailed chart values and detailed chart functionality.
Two spark grid models are provided: Spark Line Grids and Spark Bar Grids . The two spar grids have the same functionalities with different visualization models.
Spark Line vs Spark Bar
The examples below highlight the difference between the two visualization models.
| SparkLine | SparkBar |
|---|---|
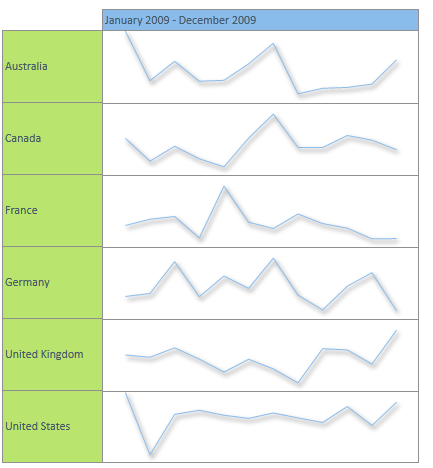
|
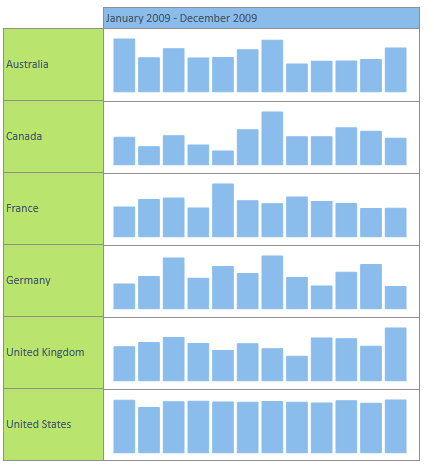
|
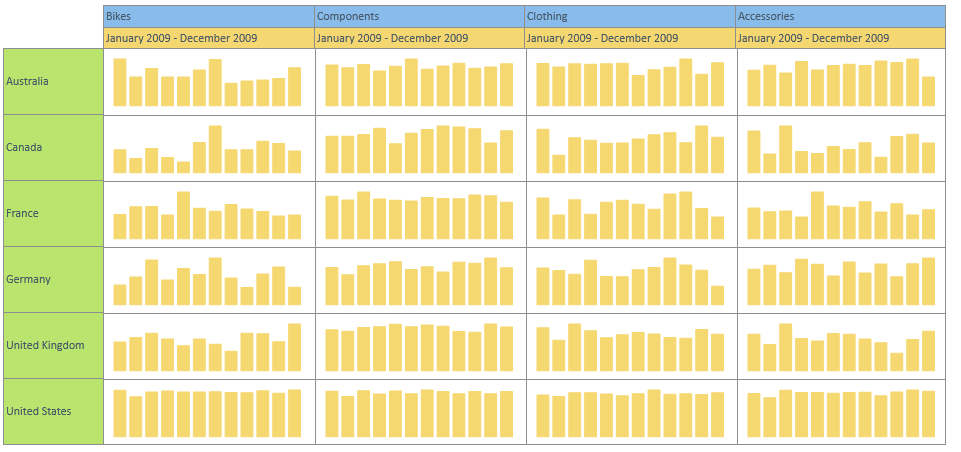
Spark "Chart Categories"
The categories for a spark grid come from the columns of a query. By definition, the first hierarchy's elements on the column axis are used to drive the categories of the micro-charts. If you use two or more hierarchies on the column axis, the spark grid engine will create nested, multi-charts within the grid. This is highlighted in the example below, where the SparkBars are created using the months January 2009 to December 2010 for each product category (Bikes, Components etc.).
NOTE: The spark bars are auto-colored to match the color of the hierarchy in the grid
Home |
Table of Contents |
Index |
User Community
Pyramid Analytics © 2011-2022